Making Embedded Chart Request
Please read general information about Query Api first and Creating Query Request to get to know query api.
In this page you will learn about how to get your query results displayed in a chart by using iframe. Contructing a Query part is same as normal query api that returns data as json. In addition to those fields, you will add couple of chart related fields to request and you will get an iframe url as api response.
Let's look at an example, chart_type and chart_options are only additions to normal query;
curl --request POST 'https://api.eventbunker.io/v1/query/iframe' \
--header 'x-eventbunker-query-key: <YOUR-QUERY-API-KEY>' \
--header 'Content-Type: application/json' \
--data-raw '{
    "chart_type": "area",
    "chart_options": {
        "background": "#fff",
        "enable_zoom": true,
        "enable_sparkline": false,
        "show_legend": true,
        "title": { "text": "Query Count & Duration", "position": "left" },
        "subtitle": { "text": "This Week" },
        "x_axis": { "type": "datetime", "alias": "eb_time_bucket" },
        "y_axis": [
            { "alias": "avg_time_ms", "title": "Avg Query Duration" },
            { "alias": "count", "title": "Query Count" }
        ]
    },
    "time_period": "current_7_days",
    "interval": "day",
    "fill_zero": true,
    "computations": [
        { "field_name": "metric_value", "alias": "avg_time_ms", "function": "avg" },
        { "field_name": "event_name", "alias": "count", "function": "count" }
    ],
    "filters": [
        { "field_name": "event_name","op": "equals","value": "query_request" }
    ]
}'
Response contains iframe url that you can use in your code to create an iframe element.
{
  "iframe_url": "https://embed.eventbunker.io/iframe/6101f1be-a50b-4ba6-9622-1bdb7ff62cf3",
  "query_duration": 0.109,
  "eventbunker_api_reference": "da2415c5-c48a-483d-9ed7-6f88f05b5e77"
}
You can use iframe_url to create iframe element as below;
<iframe src="https://embed.eventbunker.io/iframe/6101f1be-a50b-4ba6-9622-1bdb7ff62cf3"
  width="400" height="300"></iframe>
And here is how embedded chart looks like;
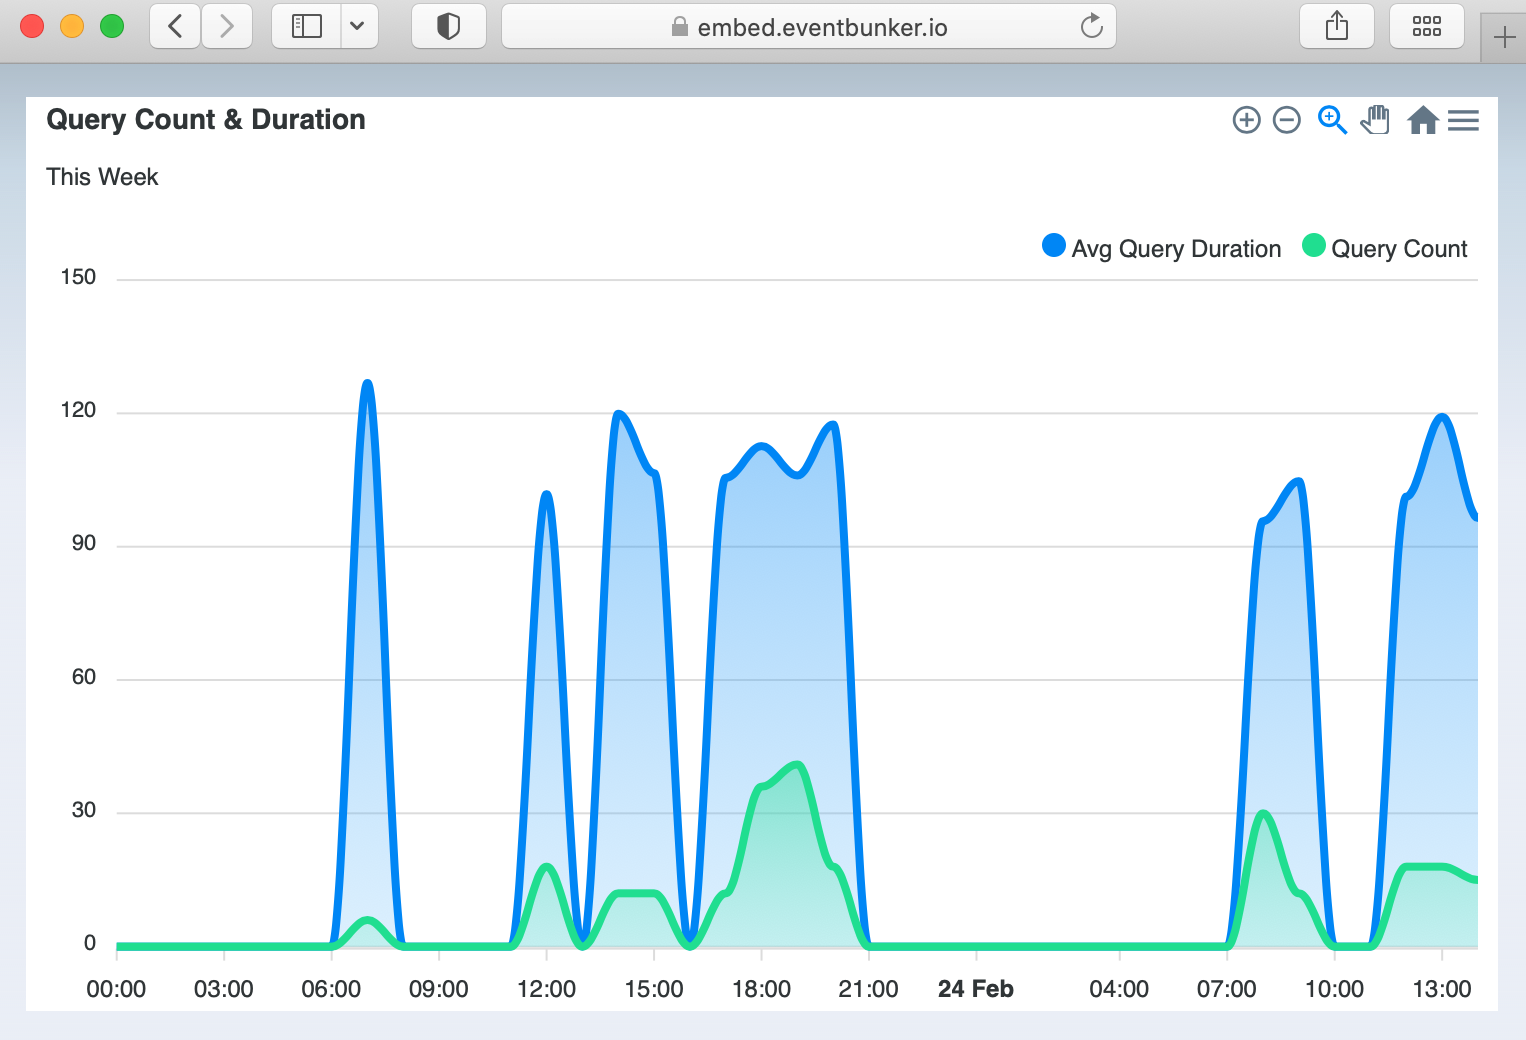
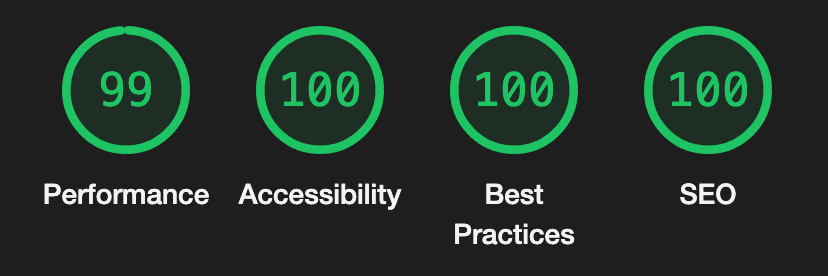
Embed iframe is very light-weight, does not contain any tracking cookie, works with a minimal framework boilerplate only. Total page size is 148kb and 126kb of this is chart library itself served by cdn, so EventBunker has a minimal footprint on your web application. As a result of this, we get 99 score from Chrome Lighthouse tool.
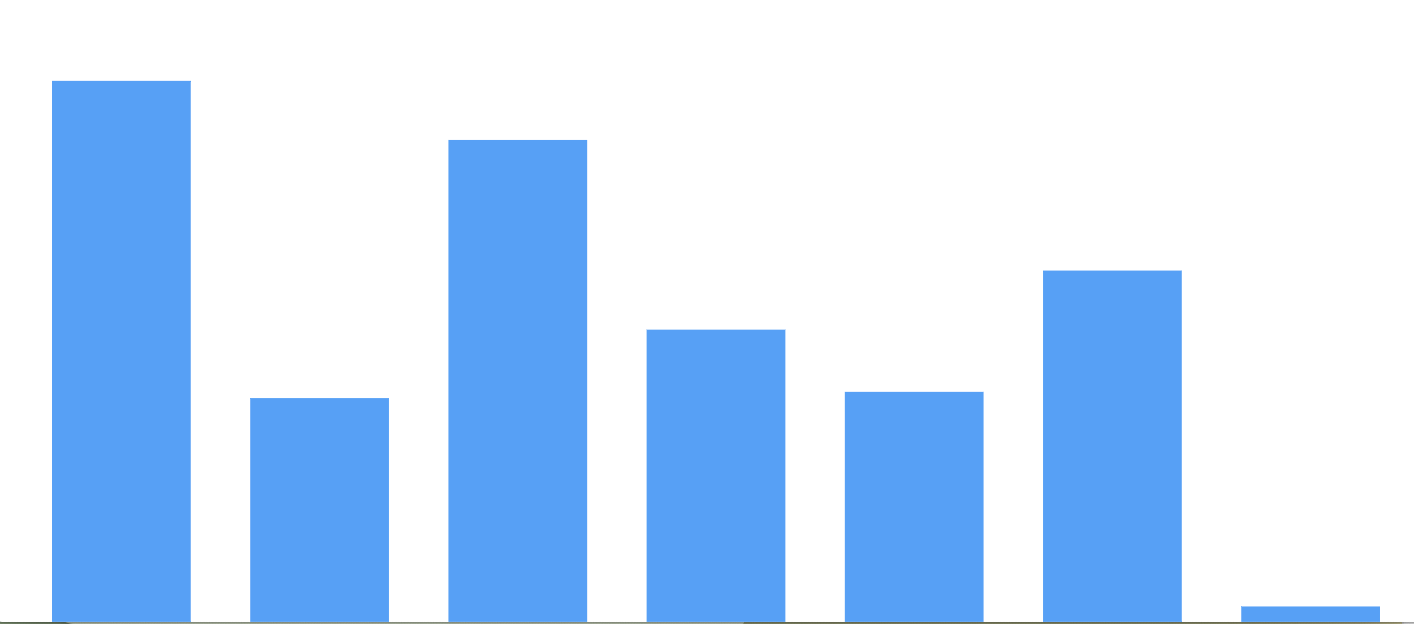
You can create minimalistic sparkline charts;
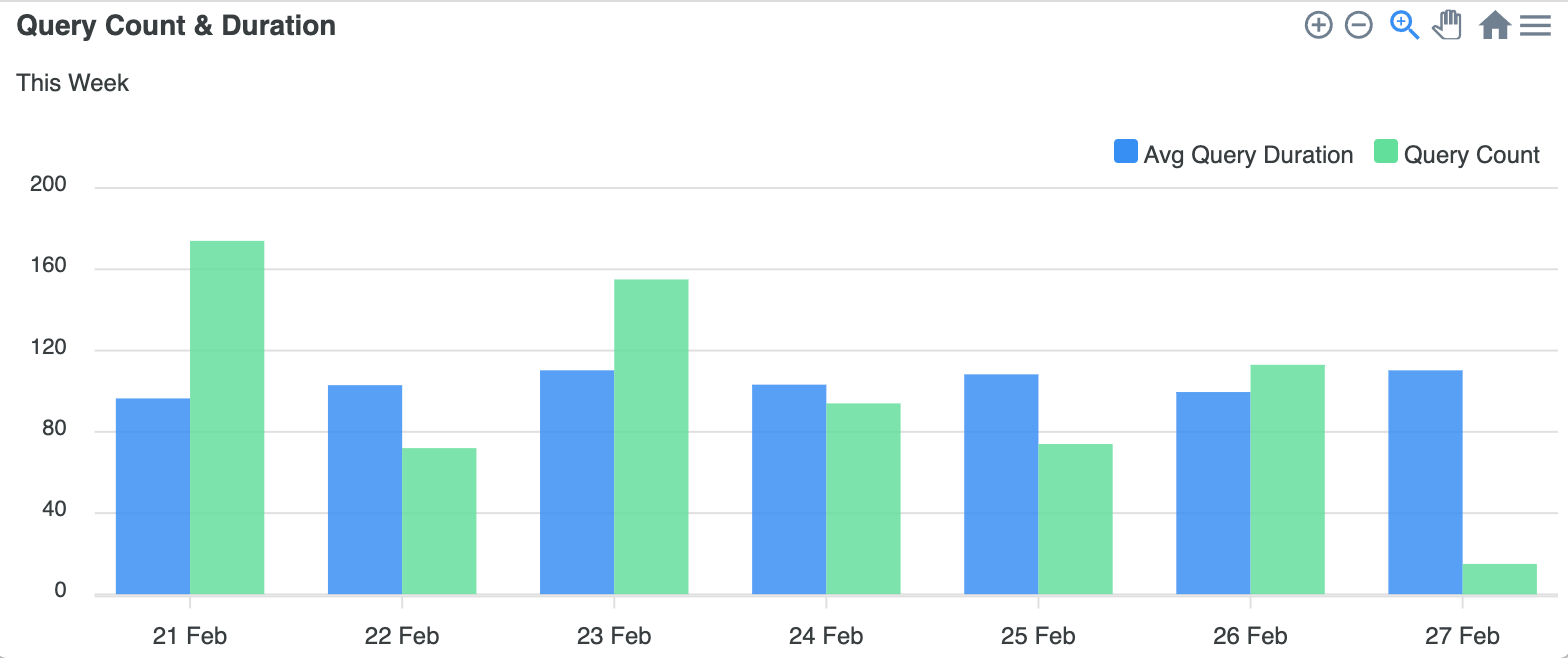
As well as full feature multi Y-axis zoomable charts with legend and title;
Query Endpoints
Embedded Chart IFrame Endpoint;
POST https://api.eventbunker.io/v1/query/iframe